TradeTally
- Platform
- Web Docker iOS
- Licence
- Apache-2.0 Open source
- Website
- tradetally.io
- Source code
- github.com/GeneBO98/tradetally
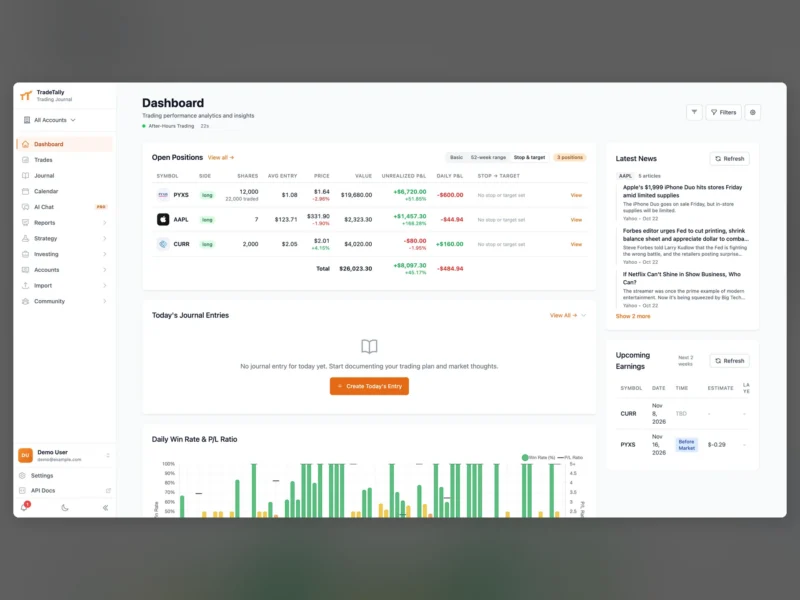
TradeTally is a trading journal with analytics built around it: import the fills from your broker, and the same data becomes an equity curve, a win rate, a profit-and-loss ratio per day, a trade calendar and a record you can annotate trade by trade. The application is a Vue front end over a Node/Express API with PostgreSQL behind it, shipped as a Docker image, and it is also offered hosted at tradetally.io — self-hosting the open source build includes the features the hosted plan sells as Pro, so the difference is who supports the server, not what the software does.
Importing trades
Trades come in from broker exports rather than being retyped: the importer reads statements from Lightspeed, Charles Schwab, ThinkorSwim, IBKR, E-Trade and ProjectX, and there is a manual entry path alongside it. Options and futures contracts are handled as their own instrument types with their own analytics instead of being flattened into share equivalents, which is what makes contract multipliers and expiry dates line up in the figures.
The dashboard
The dashboard opens on open positions: symbol, side, share count, average entry, current price, position value, unrealised and daily profit or loss, and any stop or target the trade carries, with totals underneath. Around it sit the day’s journal entry prompt, a daily win-rate and profit-and-loss-ratio chart, a news feed filtered to the symbols you trade, and upcoming earnings for the same names, all on one screen so the plan for the day is in front of you before the market opens.
Journal, calendar and trade management
Every trading day can carry a written journal entry, and the calendar overlays results onto the month so a run of green days and the drawdown after it are visible as a shape rather than a table. Individual trades open into a management view that tracks the trade in R-multiples against the initial risk, so a position is judged by what it did relative to what was risked instead of by the dollar amount alone.
Analytics
Beyond the headline win rate, the analytics pages break performance down by hold time, day of the week and sector, so the question “when do I actually make money” has a specific answer rather than an average. A behavioural layer goes after the patterns traders usually cannot see in themselves: revenge trading after a loss, overconfidence after a win streak, loss aversion, and the profit left on the table when a winner was closed early. The same analytics engine can be pointed at a cloud model or a local one, including a Codex or Claude CLI provider, for plain-language reads of the trade history.
Market data, watchlists and alerts
Live quotes, unrealised profit and loss, watchlists with news, price alerts by email and in the browser, and earnings tracking all depend on a market-data provider: the project documents a Finnhub Basic plan as the way to get the full set, with a free tier that drops some of it. Without a key the journal still works from imported history, but the live numbers and the alerting do not.
Running it
The published image is potentialmidas/tradetally on Docker Hub, and the shortest path is docker run -d -p 80:80 potentialmidas/tradetally:latest; the deployment guide at docs.tradetally.io covers the PostgreSQL and API-key configuration a production install needs. Building from source takes Node.js 24 or newer and pnpm, with the backend and frontend started separately in development. An iOS app exists for the hosted service, and the health-tracking feature — correlating sleep and heart rate with results — is iOS-only because that is where the data comes from.
What it is not
It is not a broker and it does not place orders; it reads what you already did. The behavioural, watchlist and alert features are the parts most tied to a market-data subscription, so a fully offline install is a journal and an analytics tool rather than a live terminal. Trade history lives in PostgreSQL, so a self-hosted install is a database backup away from portable, and the community leaderboard and forum are features of the hosted service rather than of a private instance.