Sentry
- Platform
- Docker Web
- Licence
- FSL-1.1-Apache-2.0 Source-available
- Website
- sentry.io
- Source code
- github.com/getsentry/sentry
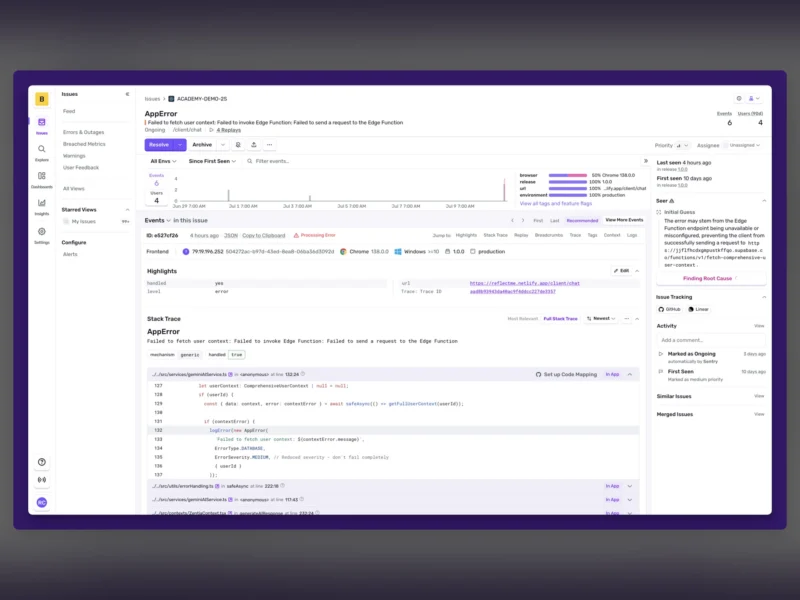
Sentry is a developer-first error tracking and performance monitoring platform. Your application reports exceptions and traces to Sentry, which groups them into issues, shows the stack trace with the surrounding source, and tells you which release, browser or device a failure came from — so a production crash becomes a fixable bug report instead of a log line nobody reads.
How it works
You create a project, install the Sentry SDK for your language and initialise it with the project’s DSN. Unhandled exceptions, handled errors and — once tracing is enabled — performance transactions then arrive automatically. Sentry groups events into issues by fingerprint, tracks first-seen and last-seen times, and flags a regression when a resolved issue comes back. An issue page gives you the stack trace with source context, the breadcrumbs recorded before the failure, tags, device and release information, and every event in that group.
Key features
- Error monitoring — exceptions grouped into issues with stack traces, source context, breadcrumbs, tags, and suspect commits that point at the change likely to have caused the failure.
- Tracing and performance — distributed traces across services, so you can see which endpoint or database query is slow and how much of a request’s latency it accounts for.
- Session Replay — a privacy-masked, video-like recording of the session that produced an error, so you can watch what the user did before the crash.
- Logs, metrics and uptime — structured logs, custom metrics and uptime monitors alongside the errors, sharing the same alert rules.
- Cron and job monitoring — scheduled jobs check in, and you are alerted when one does not run on time or fails.
- Profiling — CPU profiles attached to traces to find the hot function behind a slow transaction.
- Alerts and routing — rules on issue frequency, metric thresholds or uptime, delivered to Slack, email, PagerDuty, Discord, Microsoft Teams or a webhook.
- Releases and source maps — attach commits, source maps and debug files to a release so a minified production stack trace reads like your own code.
- Broad SDK coverage — Python, JavaScript/TypeScript, PHP, Ruby, Go, Java, .NET, Rust, C/C++, React Native, Flutter and more.
- Dashboards and Discover — query raw events and build dashboards without shipping data to a separate analytics stack.
Deployment
Two routes. The hosted service at sentry.io is a SaaS with a free Developer plan (limited to one user, 5,000 errors and 5 million spans a month, 50 session replays) and paid plans billed as usage grows. Self-hosting uses the getsentry/self-hosted repository: a Docker Compose stack of Postgres, Redis, Kafka, ClickHouse, the Sentry web services and their workers, which the project describes as feature-complete but aimed at low-volume deployments and proofs of concept. Budget real memory and disk, and expect upgrade work between releases.
Licence
Not open source. Sentry is released under the Functional Source License 1.1 with an Apache 2.0 future licence (FSL-1.1-Apache-2.0). The source is public and you may self-host and modify it, but the licence forbids offering it as a competing product or service and is not OSI-approved; each release converts to Apache 2.0 on its second anniversary. Some components and SDKs carry their own licences, and Sentry the company sells the hosted service that funds the project.