R
- Platform
- Linux Windows macOS
- Licence
- GNU GPL v2 or later Open source
- Website
- r-project.org/
- Source code
- github.com/wch/r-source
Overview
R is a language and environment for statistical computing and graphics, and it is a GNU project. Ross Ihaka and Robert Gentleman started it at the University of Auckland in 1993 as a free implementation of the S language developed at Bell Laboratories, and since 1997 it has been maintained by the R Core Team under the R Foundation. The interpreter, the graphics devices and the package manager all ship together, so the language and the statistics arrive as one install. R is free software under the GNU General Public License (version 2 or later), runs on Linux, Windows and macOS, and the current release is R 4.6.2 “Diversified Portfolio”, published on 29 October 2026.
Key Features
- Statistics in the core language — linear and generalised linear models (
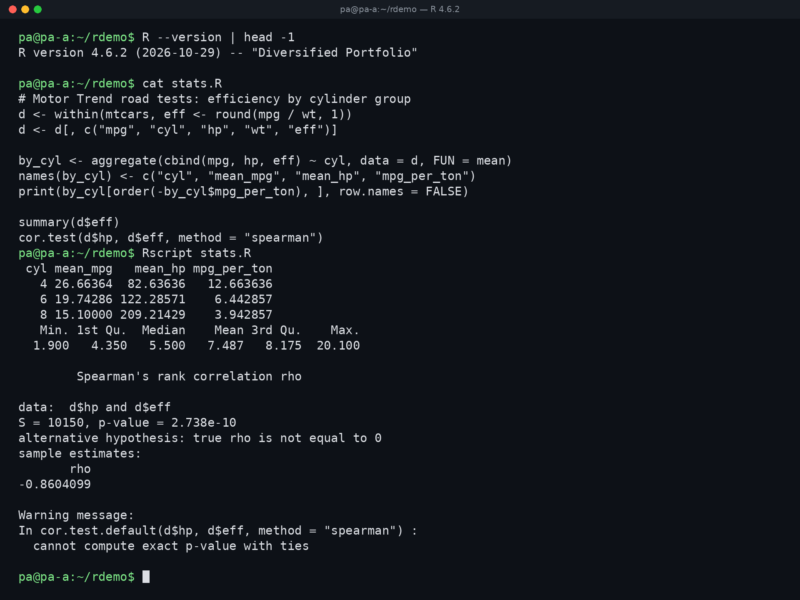
lm(),glm()), classical tests (t.test(),chisq.test(),cor.test()), analysis of variance, time-series functions and a model-formula syntax are part of base R, not a library you add. - Data frames and vectorisation — the table type is a first-class object, and column-wise arithmetic, subsetting with
d[rows, cols]and grouping withaggregate()work without a loop; the tidyverse’sdplyrandtidyradd a reworked grammar on top. - Publication-quality graphics — base graphics and
ggplot2draw plots with mathematical notation, and the device layer writes PDF, SVG, PNG and PostScript without leaving the session. - CRAN — 25,700 contributed packages at the time of writing, covering machine learning, econometrics, biostatistics, geospatial data and most published statistical methods, installed with
install.packages("name"). - Reproducible reporting — R Markdown and Quarto interleave code with prose to produce HTML, PDF and Word documents, and
renvlocks package versions per project so an analysis still runs a year later. - Interactive and batch modes — the console for exploration,
Rscript file.Rfor cron jobs and pipelines, andR CMD checkfor packaging your own code. - Web apps and APIs — Shiny turns a fitted model into a server-hosted application, and
plumberexposes R functions as REST endpoints. - Interoperability —
Rcppcalls C and C++ at native speed,DBIand its drivers talk to PostgreSQL, MySQL and SQLite,reticulateembeds Python, andknitroutput lands straight in LaTeX.
Why Use R?
R is what a language looks like when statistics came first. A regression that needs several libraries and a glue layer elsewhere is one function call here, and it returns an object you can print, plot, summarise and test rather than a screen of numbers to interpret by hand. The ecosystem is the other half of the argument: because the people who publish new statistical methods usually publish R code with them, CRAN tends to have the implementation before any other language does, and the packages are peer-reviewed for correctness rather than only for API design. It plays well with an existing stack instead of replacing it — C++ hot loops through Rcpp, Python libraries through reticulate, SQL databases through DBI, LaTeX through knitr — and it is GPL software with identical behaviour on Linux, Windows and macOS. The cost is a few rough edges: base R’s syntax is idiosyncratic, memory-hungry operations are slower than a tuned C or Julia implementation, and a serious project usually needs the tidyverse on day one to stay readable.
Use Cases
- Statistical analysis, hypothesis testing and regression modelling.
- Academic, clinical and epidemiological research, where reference implementations of new methods appear first.
- Cleaning and reshaping tabular data before it reaches a model or a report.
- Publication figures for papers, using ggplot2 or the base graphics device.
- Reproducible analysis pipelines and automatically regenerated reports.
- Time-series forecasting and econometrics, with the forecast, xts and zoo packages.
- Machine-learning prototypes with caret or tidymodels before anything is productionised.
- Shiny dashboards and plumber APIs built directly on an existing analysis.
Getting Started
Install the interpreter from CRAN or from your distribution — sudo apt install r-base on Debian and Ubuntu, the signed .pkg installer on macOS, the Windows installer from CRAN — then check it with R --version. Start the console with R, run a file with Rscript script.R, and quit with q(). Packages install from a CRAN mirror with install.packages("ggplot2"); on Linux, distribution packages for the heavy dependencies (libcurl, libxml2, libssl) save a long compile. RStudio Desktop and the VS Code R extension give the interpreter an editor, but neither is required, and R itself is a separate install from both. The source lives in the R Subversion repository with a read-only GitHub mirror, and the R FAQ documents the licence terms and the supported platforms.