Kubetail
- Platform
- Web Linux macOS Windows Docker
- Licence
- Apache-2.0 Open source
- Website
- kubetail.com
- Source code
- github.com/kubetail-org/kubetail
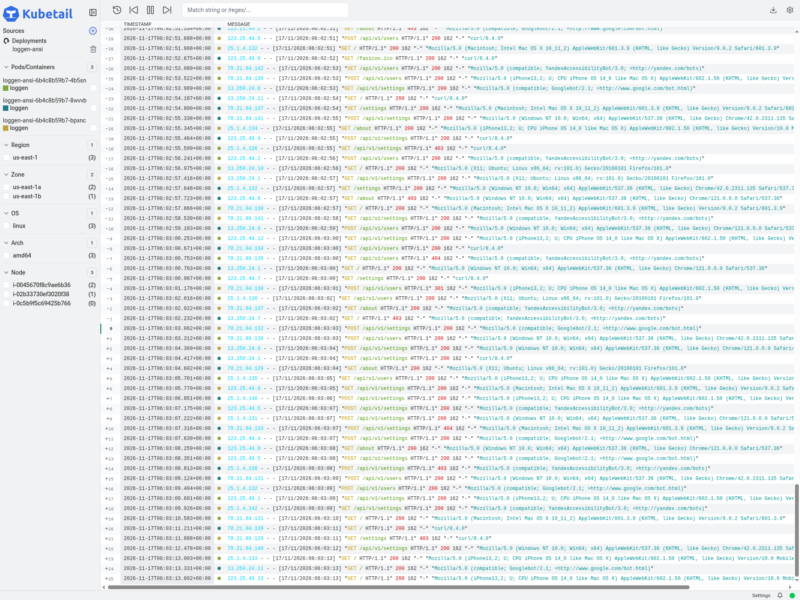
Kubetail is a real-time logging dashboard for Kubernetes that keeps the plain kubectl logs -f workflow but puts a browser in front of it. Point it at a cluster and it lists the running workloads; pick one and every container in it – current pods, replacements, ephemeral containers – streams into a single chronological timeline instead of one terminal window per pod.
Log messages are read directly from the cluster’s Kubernetes API. Nothing is forwarded to an external service and no log shipper has to be deployed first, so a line reaches your screen only if the API server can already return it. The same tool is both the terminal client and the dashboard: kubetail logs -f deployments/my-app tails to stdout, kubetail serve opens the web interface.
What it does
- Merges the logs of every container in a workload – Deployment, StatefulSet, DaemonSet, CronJob – into one chronological, colour-coded timeline.
- Follows the workload rather than the pod, so the stream continues when a pod is replaced during a rollout.
- Filters by workload, absolute or relative time range, grep pattern, and node properties such as availability zone, CPU architecture and node ID.
- Tracks container lifecycle events through the Kubernetes API to keep the timeline in step as containers start, stop or get replaced.
- Switches between clusters from a single window on the desktop build.
- Keeps user settings in a config file (
kubetail config init) that can be edited by hand or through the dashboard, and synced between machines. - Runs on a desktop, inside the cluster, in a plain container from the
ghcr.io/kubetail-org/kubetail-cliimage, or against Minikube. The CLI ships through Homebrew, Krew, Snap, Winget, Chocolatey, Scoop, apt, dnf, zypper, Alpine, Arch, Gentoo, Nix, asdf and MacPorts, with release binaries and an install script for everything else.
Optional cluster components
The dashboard works against the Kubernetes API on its own. A second tier – the Kubetail API, a cluster-side API server plus an agent, installed with kubetail cluster install or the Helm chart – adds log search, log file sizes and last-event timestamps, and brings node-level system logs such as systemd into the same timeline as container logs.
What it is not
Kubetail is a debugging viewer, not a log platform: it stores nothing after the fact, so there is no archive to search next week and no alerting. Keep shipping to Loki or Elasticsearch if you need retention, dashboards over months or paging, and use this when you want to read what is happening on the cluster right now. The project’s own roadmap is honest about the order of work – real-time search, system logs, customisation, then parsing and metrics – so treat it as a fast-growing viewer rather than a finished observability stack.
Alternatives
- Dozzle – the same idea for plain Docker: a read-only container log viewer in the browser.
- Grafana – queries Loki or Elasticsearch for historic logs with dashboards and alerting, but needs a log pipeline behind it.
- Portainer – container and stack management UI that can show container logs, though it is not built around multi-container timelines.
- stern and k9s – terminal-only Kubernetes log tailing and cluster management, with no browser view.