Nightingale
- Platform
- Linux Docker
- Licence
- Apache-2.0 Open source
- Website
- n9e.io
- Source code
- github.com/ccfos/nightingale
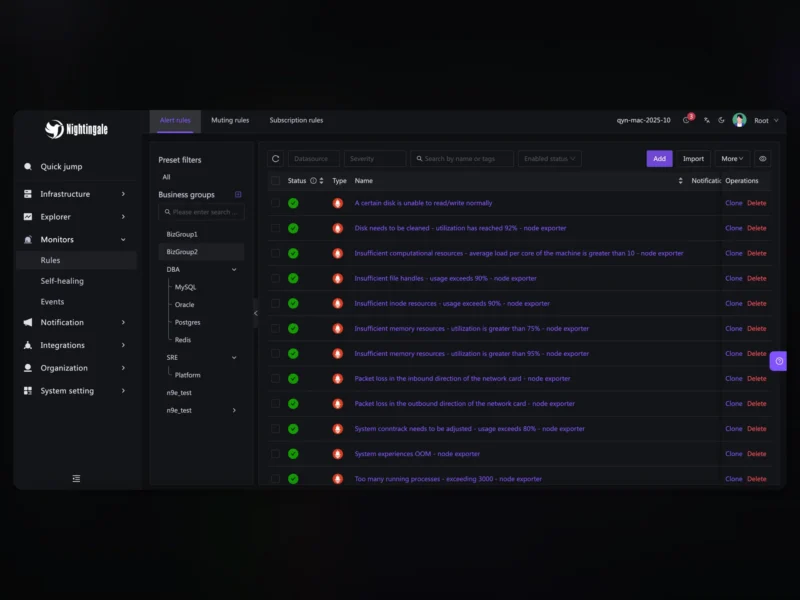
Nightingale is a self-hosted alerting platform for metrics, logs and databases. It connects to the data sources a team already runs – Prometheus, VictoriaMetrics, Elasticsearch, Loki, ClickHouse, MySQL or PostgreSQL – evaluates alert rules against them, processes the resulting events, and routes notifications to chat, on-call and ticketing tools. Collectors, storage and Grafana dashboards stay where they are; Nightingale adds the alerting layer on top of them.
It is a Go application from the CCF (China Computer Federation) open source project, published under Apache-2.0, and aimed at SRE and platform teams who want alert rules, per-team ownership and delivery records in one place instead of spread across Prometheus, Alertmanager and a set of scripts. The project ships in English as well as Chinese, with documentation, releases and an active issue tracker on GitHub.
What it alerts on
- PromQL for metrics sources, log queries for Loki and Elasticsearch, and SQL for ClickHouse or relational databases, so one rule shape covers several storage engines
- A single rule applied to multiple instances of the same data source type, avoiding duplicated rule sets for a fleet of Prometheus servers
- Event processing between the rule and the notification: muting, subscriptions, label enrichment and rewriting, and conditional routing on event content
- Execution records that keep the query, its result at fire time, the active and historical events, and every notification delivery attempt
Teams, routing and delivery
- Rules and dashboards grouped into business groups with per-team permissions, and sign-in through OIDC, OAuth2, LDAP or CAS
- Native notification channels for Slack, PagerDuty, Discord, Telegram, Mattermost, email, Jira and Jira Service Management, plus HTTP webhooks and scripts for custom destinations
- Bundled collector configurations, alert rules and dashboards as starting points, with distributed evaluation across alerting engines and optional
n9e-edgenodes placed close to remote data sources - Optional self-healing: the companion ibex runner executes predefined remediation scripts when an alert fires
- Prometheus alert rule import (expressions, durations, labels, annotations) and JSON export over the HTTP API for Git-driven rule workflows
Built-in AI agent and MCP
The web UI includes an agent that queries the instance’s own monitoring data and configuration. It investigates why an alert fired, traces why a notification did or did not arrive, and drafts rules and dashboards for confirmation before they are saved; team procedures can be added as custom Skills, including Skills imported from Git. Model access is configured by the operator and can point at OpenAI-compatible APIs, Claude, Gemini or a self-hosted endpoint. Core alerting runs without it. External assistants reach the same instance through an MCP server mounted at /mcp, which exposes read tools by default and applies the caller’s API permissions; A2A lets another agent delegate a task to the built-in one.
Deployment and requirements
The quickest path is the bundled Docker Compose stack, which brings up Nightingale with MySQL, Redis, VictoriaMetrics and the Categraf collector and serves the UI on port 17000. Linux binaries for amd64 and arm64 are published with each release, and a Helm chart covers Kubernetes. A single instance stores metadata in MySQL or SQLite and can use an embedded time-series database, while multi-instance deployments share the metadata database and Redis and should use external time-series storage. For production the project’s guidance is to pin a release, configure credentials and TLS, back up the metadata database, and watch rule evaluation and notification failures.
Alternatives
- Prometheus – metrics collection and rule evaluation, with Alertmanager handling routing
- Grafana – dashboards and unified alerting across connected data sources
- Zabbix – agent-based infrastructure monitoring with its own database and escalation logic
- Checkmk – curated checks for servers, networks and applications with a setup GUI
- Uptime Kuma – a small self-hosted uptime monitor and public status page