Global Threat Map
- Platform
- Web Docker Self-hosted
- Licence
- No licence file (source-available) Source-available
- Source code
- github.com/unicodeveloper/globalthreatmap
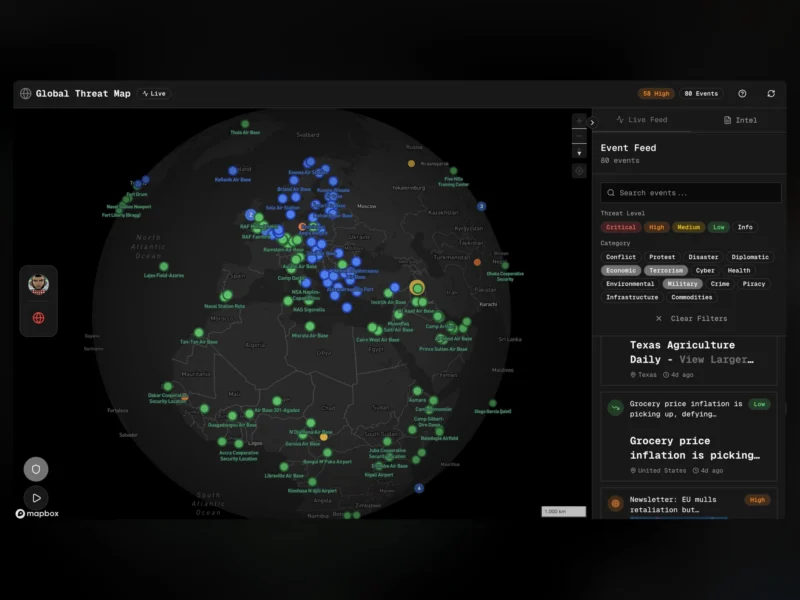
Global Threat Map is a real-time situational-awareness dashboard: it plots security events, geopolitical developments and threat indicators on an interactive world map and pairs that view with a filterable live feed of the underlying reports. The project describes itself as an OSINT command centre — conflicts, protests, disasters and diplomatic or economic news arrive as map markers colour-coded by threat level, and clicking a country opens its own dossier of historical and current conflicts. It is built with Next.js 16 and Mapbox GL, and the live instance runs at globalthreatmap.up.railway.app.
How it works
The map fills most of the screen, with the event feed alongside it. Markers cluster at low zoom and can be switched to a heatmap to show where incidents are concentrated; nearby events are grouped so a busy region stays readable. Each event carries a headline, an age, a location and a threat level, and the feed can be filtered by threat level (critical, high, medium, low, info) and by category (conflict, protest, disaster, diplomatic, economic, environmental, health, crime, policy). A search box narrows the feed further, and an auto-pan mode slowly moves the map across the globe for a wall-display style overview.
Features
- Real-time event mapping — breaking news plotted with colour-coded threat levels, clustering and a heatmap view.
- Event feed — live, searchable and filterable by threat level and category, with running counters for high-severity and total events.
- Country intelligence — select any country to see historical conflicts (wars, engagements, dates, opposing parties and outcomes) and current conflicts (ongoing wars, border disputes, civil unrest, terrorism threats) in separate tabs.
- Military bases layer — US bases as green markers and NATO installations as blue markers, with type and host country on click.
- Intel dossiers — deep-research reports on a named actor, with CSV export and PowerPoint briefing output.
- Alerts — keyword and region based alerts with real-time notifications.
- AI-assisted analysis — conflict summaries are synthesised through the Valyu search and answer APIs, with cited sources.
Running it yourself
The repository is a Next.js 16 application (App Router, TypeScript, Tailwind CSS v4) that talks to Mapbox GL JS through react-map-gl for the map and to Valyu for search, answers and deep research, with zod for schema validation and Zustand for state. There is a one-click Railway deploy template, but a self-hosted deployment needs its own Mapbox access token and Valyu API credentials, so expect both to be required before the map and the feeds populate. Because analysis is generated on demand, running costs track your own provider usage rather than a per-seat subscription.
Licensing
The repository carries no licence file. The source is published publicly on GitHub but is not formally open source, so default copyright applies and reuse or redistribution is not granted by the author. The hosted instance is free to use in a browser. Treat the code as source-available and check with the author before building on it.
Who it suits
Analysts, journalists and OSINT hobbyists who want a single map-and-feed view of open reporting, or teams that need a quick briefing artefact (a dossier export) rather than a full intelligence platform. More related tools sit in the Threat Intelligence and Incident Response category.