Nezha Monitoring
- Platform
- Docker Linux
- Licence
- WTFPL Open source
- Website
- nezhahq.github.io
- Source code
- github.com/nezhahq/nezha
Nezha Monitoring is a self-hosted server and website monitoring panel. A central dashboard collects state from a lightweight agent installed on every machine, and puts server health, service checks, alerts and routine operations behind a single web interface.
It is built for VPS fleets, cloud instances, home labs, NAS boxes and nodes spread across providers. Two components do the work: the dashboard is the control plane – it authenticates users and agents, stores configuration and history, schedules checks and tasks, and serves both an admin frontend and a public user frontend – while the agent runs on each monitored host, reports metrics, performs service checks and executes the tasks it is given. The dashboard runs comfortably on a single core with 512 MB of RAM, and configuration lives in SQLite with an optional time-series database for metric history.
What it monitors
- Host state reported by each agent: CPU, memory, swap, disk usage, network throughput, monthly traffic consumed, process count and connection count
- Service monitors executed from the agents: HTTP GET checks that also track the target’s TLS certificate, ICMP ping and TCPing, each with a 30-day availability view
- Threshold alerts on any collected metric, with the notification channel chosen per rule; message bodies can carry placeholders such as
#DATETIME#and#NEZHA#, be sent as form data or JSON, and can skip TLS verification for self-signed endpoints - Certificate changes and upcoming expiries, which are useful for catching a renewal that silently stopped happening
Operations features
- Web terminal, file access and scheduled task execution on the agents, gated by panel permissions
- Server grouping and per-item visibility flags, so a public status page can show what guests are allowed to see and hide the rest
- REST API plus a Model Context Protocol endpoint, which lets external tooling and AI agents read state and run authorised operations
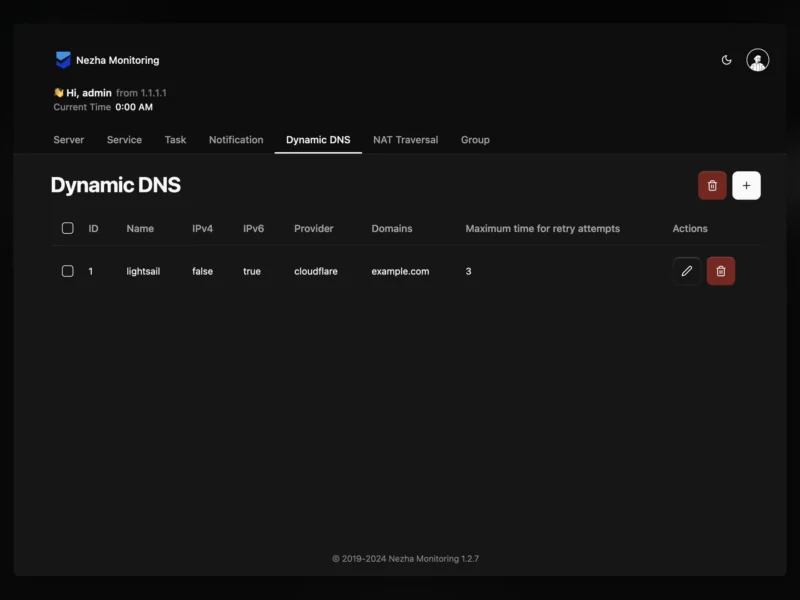
- Dynamic DNS with per-provider configuration and retry limits, for hosts whose public address changes
- NAT traversal for agents that sit behind address translation
- Interface translation through Weblate, with English and Chinese documentation
Deployment and requirements
The supported installation path is the project’s install script, which offers a Docker deployment or a direct install on the host. The dashboard listens on port 8008 by default and that port has to be reachable by every agent, so firewall rules or a reverse proxy in front of it are part of the setup; a domain with an A record pointing at the dashboard is expected. If a CDN is placed in front of the public frontend it must pass WebSocket traffic, and the project recommends a second, unproxied hostname for agent-to-dashboard communication because CDN support for gRPC and long-lived connections varies. Agents talk to the dashboard over gRPC, which an HTTPS reverse proxy can carry.
Where it stops
The project is explicit that Nezha is not a log analytics platform, an application performance monitoring system or a general-purpose metrics query engine – it is a status, availability and operations panel. Every agent must be able to reach the dashboard endpoint, which means either exposing it (behind authentication) or tunnelling to it from each network, and hosts behind a firewall that cannot reach the dashboard will stay invisible.
Alternatives and related tools
- Uptime Kuma – a lighter option focused on service uptime checks and status pages
- NetAlertX – discovery-led network inventory and device presence alerting rather than per-host metrics
- Zabbix – full infrastructure monitoring with templates, agents and long-term trending
- Prometheus – metric collection and time-series storage for query-driven monitoring
- Grafana – dashboarding over Prometheus and other metric sources
- Nagios – classic host and service availability checks with a long plugin history