Logdy
- Platform
- Linux macOS Windows Docker
- Licence
- Apache-2.0 Open source
- Website
- logdy.dev
- Source code
- github.com/logdyhq/logdy-core
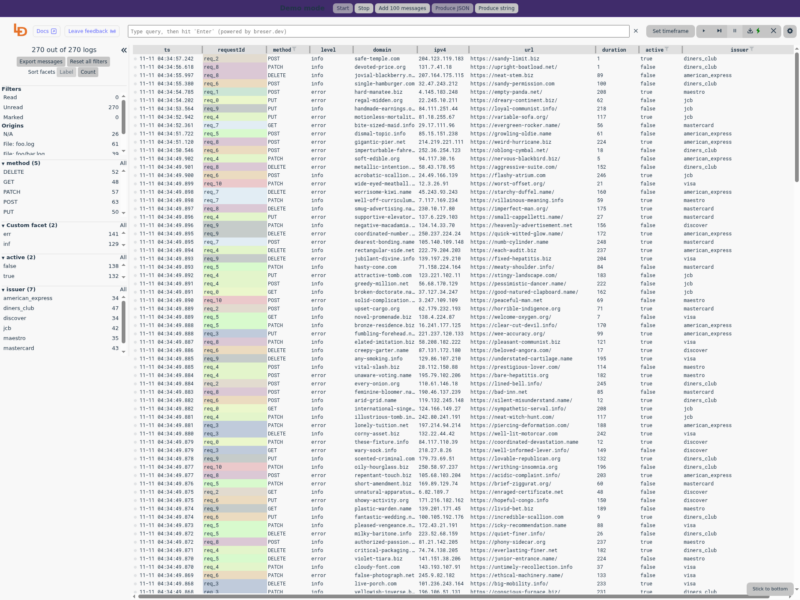
Logdy is a single-binary log viewer that puts a browser interface on any stream of text you can pipe into it. You hand it the output of tail, journalctl, kubectl logs or a plain shell command, and it opens a local web UI that parses the lines into columns, keeps a live tail, and lets you filter, facet and search without learning a query language first. It is written in Go, ships as one dependency-free executable for Linux, macOS and Windows, and runs entirely on your own machine or server, so log lines never leave the box you are reading them on.
Pipeline first, not index first
There is no agent to install on every host and no index to keep in sync. Logdy reads from standard input, so it drops into the place of grep or less in an existing pipeline: tail -f app.log | logdy gives you a live view, and logdy follow app.log --full-read reads a file from the beginning. It also accepts socket and REST API input for applications that want to push events directly. The trade-off is that Logdy is a viewer rather than a store: it keeps recent lines in memory, so retention stays with whatever already writes your logs.
Filters and facets built from the data
Fields are inferred from the incoming lines and the left rail builds facets from what is actually present – log level, source file, port, or any key in a JSON payload – with a count per value. Facets combine into filters, and the log table is a virtualised grid with per-field sorting, column widths and density settings. The demo instance on the project site shows a synthetic request log with method, level, domain, duration and issuer facets to work through.
Custom parsers and columns
When inference is not enough, the parser editor takes a TypeScript snippet per field and runs it with the full JavaScript runtime, which is how multi-line formats and derived columns are handled. The editor ships type hints for the available context, so the field definitions are discoverable from inside the UI rather than from a separate reference.
Install and run
There is nothing to compile: download the release binary for your architecture and put it on your PATH, or use brew install logdy on macOS. A shell installer script is also provided. The web UI listens on port 8080 by default and binds to localhost, and the Dockerfile in the repository builds a container image for hosts that prefer to run everything that way. Logdy can also be embedded as a Go library so an application can expose its own log stream through the same interface.
Where it fits
Logdy is aimed at the moment when a log file is too noisy for tail and too small to justify standing up Loki or Elastic. It complements an existing log stack rather than replacing it: keep collection and retention where they are and use Logdy as the ad-hoc window on a single host or container. Grafana is the dashboard and alerting layer over metrics and logs, Logchef is the query workspace over ClickHouse and VictoriaLogs, and Logdy is what you reach for when the source prints to a terminal and you want to see it properly right now.
Alternatives
- Grafana – dashboards and alerting over metrics and log stores
- Logchef – self-hosted log analytics workspace over ClickHouse and VictoriaLogs
- Prometheus – metrics collection and alerting for the same infrastructure