Grafana Loki
- Platform
- Linux macOS Windows Docker Self-hosted
- Licence
- AGPL-3.0 Open source
- Website
- grafana.com/oss/loki/
- Source code
- github.com/grafana/loki
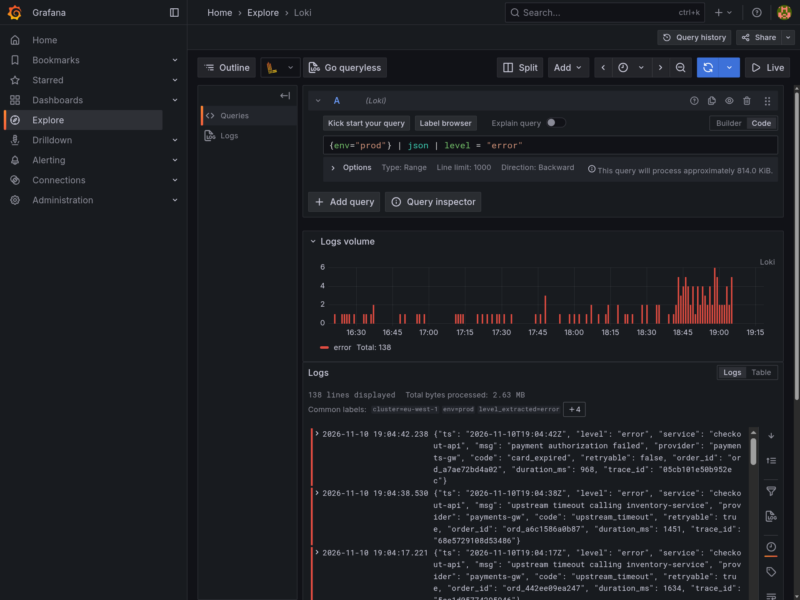
Grafana Loki is a log aggregation server built on a deliberately narrow idea: index the labels, not the text. Instead of tokenising every log line, it groups entries into streams identified by a label set, compresses the raw lines into chunks, and writes both to object storage — reusing the same labels you already have in Prometheus. The result is a log system that costs a fraction of a full-text index to run, at the price of making label design the thing that decides how fast queries are.
How the storage model works
Loki keeps two things: chunks, which hold the compressed log data, and an index that records which label sets point at which chunks. The index is the TSDB store kept alongside the chunks in the object store, and that object store can be Amazon S3, Google Cloud Storage, Azure Blob, IBM Cloud Object Storage, Baidu Object Storage, or the local filesystem for a test install. Because the bulk of the data is compressed blocks in cheap storage, growth is governed by object-store cost rather than by RAM or index size. A compactor applies the per-tenant retention period, rewrites the index and processes delete requests.
Queries with LogQL
A query starts with a stream selector and can chain a pipeline onto it: filter by substring or regular expression, parse JSON or logfmt, format the output, then compare the extracted fields. The same language turns those lines into metrics, so log volume, error rates and slow-request counts can be graphed from log data alone. The ruler component evaluates a query on a schedule and can fire into Prometheus Alertmanager or Grafana’s own alerting, and LogCLI runs the same queries from a terminal. Every query reports how many bytes it processed, which makes the cost of a badly chosen label visible instead of theoretical.
Deployment modes
Every component ships inside one binary and the -target flag decides which of them start. Monolithic mode is the single-process option, intended for roughly 20GB a day and below. Microservices mode splits the distributor, ingester, querier, query frontend, query scheduler, index gateway, compactor and ruler so each can scale on its own inside Kubernetes. On the write path the distributor validates and rate-limits streams and fans them out to a replication factor of ingesters, which hold recent data in a write-ahead log before flushing chunks to storage. HA monolithic mode sits between the two and replaces the older read/write/backend split, which is deprecated and is being removed in Loki 4.0.
The rest of the stack
Loki is the server, not the whole system. Logs arrive over an HTTP push API from an agent — Grafana Alloy is the current one, while Promtail is feature-complete and no longer developed — or from third-party collectors that ship a Loki plugin. Reading happens in Grafana’s Explore view or on a dashboard, where the log lines and their volume sit next to metrics and traces from Mimir and Tempo on the same labels. Multi-tenancy is built in: each tenant ID is isolated, which is how one cluster can serve several teams without them seeing each other’s logs.
Version and editions
Stable releases are 3.7.x, with 3.7.9 current as of October 2026; the 3.6.x line still receives maintenance patches and a 4.0 release candidate is in progress. Packages are published for Debian and Ubuntu, for RPM-based distributions, and as archives for Linux on amd64, arm and arm64, macOS, Windows and FreeBSD, alongside the official container image and Helm charts. The server is licensed AGPL-3.0 — free to run, modify and self-host — while Grafana Labs sells hosted Grafana Cloud and Grafana Enterprise Logs for teams that would rather not operate it themselves.
Alternatives
- OpenSearch — full-text search and log analytics, the opposite trade-off to label-only indexing
- Grafana — the query and dashboard front end Loki is normally read through
- Prometheus — the metrics side of the same label model