Peekaping
- Platform
- Linux Docker Web
- Licence
- MIT Open source
- Website
- peekaping.com
- Source code
- github.com/0xfurai/peekaping
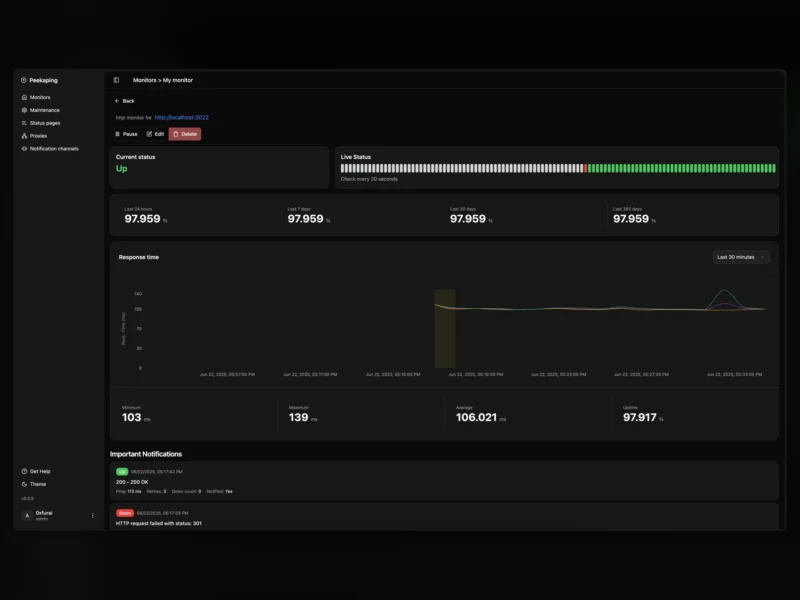
Peekaping is an uptime monitor that you host yourself: it checks websites, APIs, databases and message queues on a schedule, tells you when a check fails, and publishes a status page your users can read. It is written in Go with a React front end, and it started as a modern re-take on Uptime Kuma — the same idea, rebuilt API-first so monitoring can live in infrastructure-as-code instead of clicking through a UI.
What it monitors
- Web and network checks: HTTP/HTTPS with keyword and status matching, TCP ports, ICMP ping, DNS records and SMTP
- Application and infrastructure: push heartbeats sent from a cron job, Docker container state, gRPC and SNMP
- Databases and caches: PostgreSQL, MySQL/MariaDB, SQL Server, MongoDB and Redis
- Messaging and streaming: MQTT brokers, RabbitMQ and a Kafka producer
- TLS certificate expiry, with its own notification before a certificate runs out
Alerts and status pages
Alert channels cover the places teams already sit: Slack, Discord, Telegram, Microsoft Teams, Google Chat, Mattermost, Matrix, Signal, WhatsApp through WAHA, LINE and WeCom, plus PagerDuty, Opsgenie, Grafana OnCall and PagerTree for on-call. Email over SMTP, SendGrid, Twilio SMS, generic webhooks and the push services ntfy, Gotify, Pushover and Pushbullet are all supported. Status pages can be public or private, on your own domain, and SVG status badges drop straight into a README or dashboard. Maintenance windows — one-off or recurring — keep planned work from paging anyone.
API-first, and why that matters
Everything the web UI can do is available over a REST API with an OpenAPI spec, authenticated with API keys, so monitors and notifications can be created from a pipeline rather than by hand. A community Terraform provider (tafaust/peekaping) covers the same ground for anyone managing monitors as code. Accounts support two-factor authentication and brute-force login protection, and proxies plus tags keep large monitor sets organised.
Deployment
Single mode is one container and one process: docker run -d -p 8383:8383 -e DB_NAME=/app/data/peekaping.db -v $(pwd)/.data/sqlite:/app/data 0xfurai/peekaping:latest, serving the UI and the API on port 8383 as a non-root user, with no Redis in the stack. Storage is SQLite by default or PostgreSQL for a heavier install; MongoDB support was removed, so existing MongoDB users have to migrate. Cluster mode — Docker Compose or a Helm chart on Kubernetes — is the scale-out path, and HTTPS is left to a reverse proxy in front.
Before you rely on it
Peekaping is still in beta and its own README says so plainly: features can change between releases and it should be tried outside production first. If you need a monitor that has been stable for years, Uptime Kuma is the conservative choice; Peekaping’s case is the API, the Go runtime and the Terraform route, not maturity. A live demo at demo.peekaping.com shows the monitor page without an install.