InfluxDB
- Platform
- Linux macOS Docker
- Licence
- MIT or Apache-2.0 (dual-licensed) Open source
- Website
- influxdata.com/
- Source code
- github.com/influxdata/influxdb
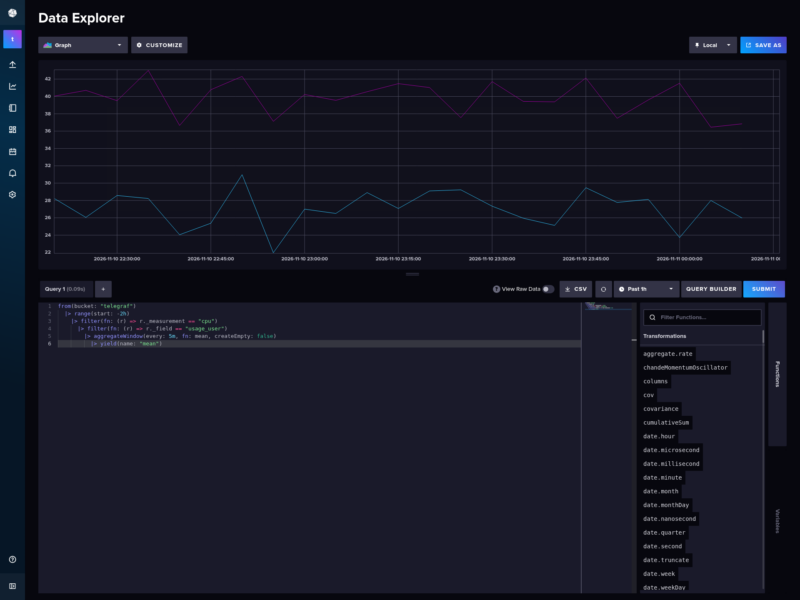
InfluxDB is an open source time series platform from InfluxData: a database built to ingest high-volume timestamped data — metrics, events, sensor readings, logs — and answer queries over it without the overhead of a general-purpose relational engine. Points arrive over HTTP in line protocol, land in a bucket with a retention rule, and are queried with SQL or InfluxQL. The current line, InfluxDB 3 Core, is written in Rust on top of Apache Arrow, DataFusion and Parquet, and ships as a single binary and a Docker image; InfluxDB 2.x remains available and is the release that carries the built-in browser UI shown here.
Key Features
- Line protocol ingestion — write points as plain text (
cpu,host=web-01 usage_user=42.1 1750000000) over the HTTP API, from Telegraf, or with a client library. - SQL and InfluxQL — InfluxDB 3 answers both dialects, plus FlightSQL, so existing BI and Arrow tooling can connect without a proprietary driver.
- Retention rules per bucket — each bucket carries its own retention period; old data is dropped automatically instead of requiring a cron job.
- Downsampling and windowing — aggregate windows (mean, max, last over 1m/5m/1h) are part of the query language, so dashboards read pre-aggregated shapes rather than raw points.
- Tasks and alerts — scheduled Flux or SQL tasks run in the background for ETL, downsampling and threshold checks, with notification endpoints for the alerts.
- Processing engine — InfluxDB 3 Core can run Python plugins inside the database for triggers and scheduled work, with a bundled Python runtime.
- Parquet-backed storage — the 3.x engine stores data in Parquet on local disk or object storage and separates the query engine from the write path.
- Client libraries — official clients for Go, Python, JavaScript, Java, C#, PHP, Ruby and Rust, plus a
influxCLI.
Who It Is For
- Operational monitoring: host, container and application metrics retained as raw points instead of pre-aggregated counters.
- IoT and sensor fleets writing many small samples per second that need to be queried by tag and time range.
- Real-time analytics where dashboards and alerts read the same store the data lands in.
- Long-term retention of event data that has to stay queryable for months on a single server.
Running It
The quickest path is the official image: docker run -d -p 8086:8086 -v influxdb2:/var/lib/influxdb2 influxdb:2.7 for the release with the browser UI, or the InfluxDB 3 Core image and the influxdb3 CLI for the Rust engine. On first launch point a browser at http://localhost:8086 to create the initial user, organisation and bucket, or run influx setup non-interactively. Linux packages (deb/rpm) and macOS builds are published on the InfluxData downloads page; Kubernetes deployments go through the official Helm chart. Data is organised per organisation and bucket, and every API call is authenticated with a token scoped to the organisation.
Open Source and Commercial Editions
InfluxDB 3 Core is the free build, dual-licensed MIT and Apache-2.0, and covers single-node deployments with the full query engine. Clustering, and the managed multi-node service, sit in InfluxDB Enterprise and InfluxDB Cloud, which are separately licensed commercial products — worth knowing before planning a multi-node cluster on the open source edition.
Related Tools
- Grafana — dashboards that read InfluxDB (and the Flux/SQL query editor) as a data source.
- Prometheus — pull-based metrics collection and alerting, often run alongside InfluxDB rather than instead of it.