Kuvasz
- Platform
- Linux Docker Self-hosted
- Licence
- AGPL-3.0 Open source
- Website
- kuvasz-uptime.dev
- Source code
- github.com/kuvasz-uptime/kuvasz
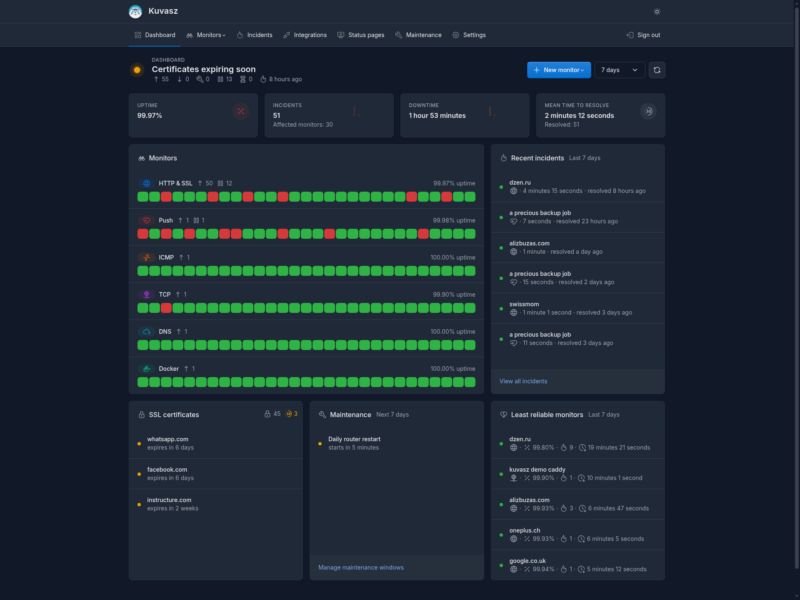
Kuvasz (pronounced roughly “kuvash”) is a self-hosted uptime and SSL monitoring service. It runs as a single Go binary or container, watches the endpoints, certificates and scheduled jobs you register, and raises alerts through whatever channel you have wired up. Unlike the hosted uptime services it replaces, there is no per-monitor subscription and no five-minute floor on the check interval: the documented default resolution is five seconds, and the number of monitors is limited only by the machine it runs on.
What can be monitored
HTTP and HTTPS checks are the core: method, headers, body, expected status code, keyword and header matchers, response-time thresholds and assertions on returned JSON. Alongside them sit SSL certificate checks that read the expiry date of the certificate a service actually serves, heartbeat (push) monitors for cron jobs and backups that must report in on schedule, ICMP ping, TCP port checks with connect latency, and DNS checks that assert on A, MX, TXT and NS records using exact, substring or regular-expression matchers and can alert when a record changes.
Kubernetes is not required, but Docker is well supported: a monitor can query the Docker daemon locally or remotely (TLS and mutual TLS included) to verify a container is running and healthy, read its healthcheck state, exit codes and OOM kills, and optionally track CPU and memory use. HTTP and TCP checks can be routed through an HTTP or SOCKS5 proxy, which covers corporate egress proxies and reaching services inside a private network.
Alerting, incidents and maintenance
Notifications are configured per monitor, so a noisy dev endpoint and a production checkout flow do not share a destination. Supported channels include email, Discord, Slack (webhook or bot), Telegram, Microsoft Teams, PagerDuty, Pushover, Apprise and generic webhooks. Downtime is recorded as incidents with a start, an end and a duration; the dashboard reports uptime percentage, incident count, total downtime and mean time to resolve over the selected window.
Maintenance windows suppress checks and the alerts they would have produced, and can be defined manually, as a recurring cron schedule or as a one-off event for a migration night.
Status pages, API and exports
Kuvasz can publish public or private status pages, grouping monitors into components with their own uptime history. The REST API exposes monitors, incidents and their state for automation, and there is an MCP server that lets an AI assistant query monitor status, list incidents and toggle checks in natural language. Metrics can be exported to Prometheus and OpenTelemetry, and an official Home Assistant integration exists for dashboards and home automation triggers.
Deployment
Official images are published as kuvaszmonitoring/kuvasz on Docker Hub, and there is an official Helm chart for Kubernetes. Configuration is file and environment driven, with a YAML-based setup for monitors and backups, and the documentation covers hardware requirements and a deployment guide. Data is stored locally in the application’s own database, so there is no external dependency to run alongside it.
Licence
AGPL-3.0. Source at github.com/kuvasz-uptime/kuvasz, documentation and a public demo instance at kuvasz-uptime.dev.