Gatus
- Platform
- Docker Web Linux
- Licence
- Apache-2.0 Open source
- Website
- gatus.io
- Source code
- github.com/TwiN/gatus
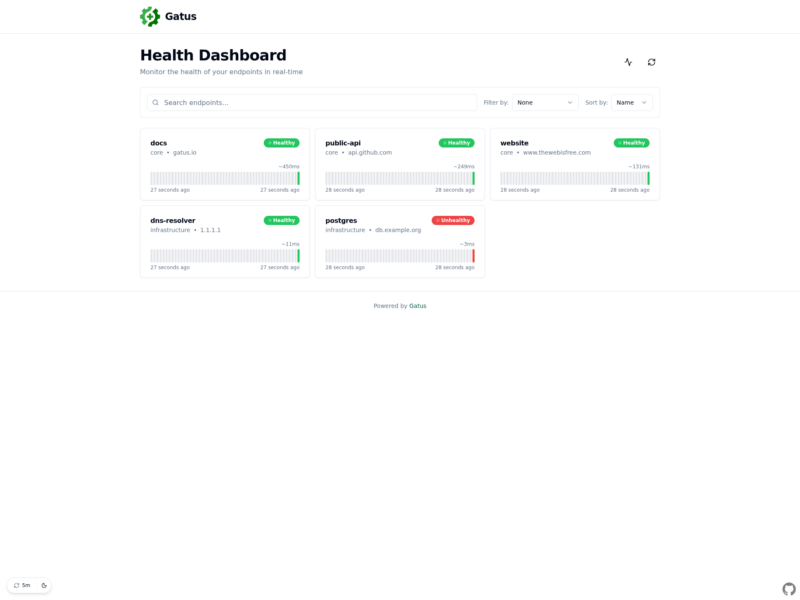
Gatus is a developer-oriented health dashboard that checks your services over HTTP, TCP, ICMP and DNS, evaluates each response against a list of conditions, and shows the result on a public status page with alerting built in. It is a single Go binary with no database requirement to start — a YAML file describes what to monitor and the service does the rest.
How checks work
Every endpoint is declared with a URL or host and a list of conditions over the status code, response time, body, certificate expiration, DNS response code and other placeholders. Checks run on their own interval, keep a rolling history for the dashboard timeline, and can send ICMP pings, open raw TCP connections or resolve specific DNS record types.
Configuration as code
The whole setup lives in one YAML file: endpoints, groups, intervals, conditions, client settings, storage and alerting. That makes the monitoring configuration reviewable in git and reproducible across environments, and it means the same file can be mounted into a container or shipped inside a Kubernetes deployment.
Alerting
Alerts go to Slack, Microsoft Teams, PagerDuty, Discord, Telegram, GitHub, GitLab, Gitea, Gotify, ntfy, Twilio SMS, email and generic webhooks, with reminders that repeat an unresolved alert at a chosen interval and silence windows for planned work. Announcements and suites (in alpha) let you publish incidents and chain dependent requests.
Status page and integrations
The built-in dashboard groups endpoints, filters and sorts them, and can be embedded as shields-style badges in a README. Uptime data is held in memory by default or persisted to SQLite or PostgreSQL, Prometheus metrics can be exposed for scraping, and the UI supports custom links, theming and announcements.
Deployment
Run the published container image with your configuration mounted at /config and the web server port exposed; no external dependency is needed for the default in-memory mode. A single small container is enough for a few dozen endpoints, and the service behaves the same on Kubernetes.
Licence
Apache-2.0 licensed — free to use, modify and self-host, including commercially.
Alternatives
- Uptime Kuma — a GUI-driven self-hosted uptime monitor
- Zabbix — full enterprise-grade infrastructure monitoring
- Prometheus — metrics collection and alerting for engineering teams