Beszel
- Platform
- Docker Linux
- Licence
- MIT Open source
- Website
- beszel.dev
- Source code
- github.com/henrygd/beszel
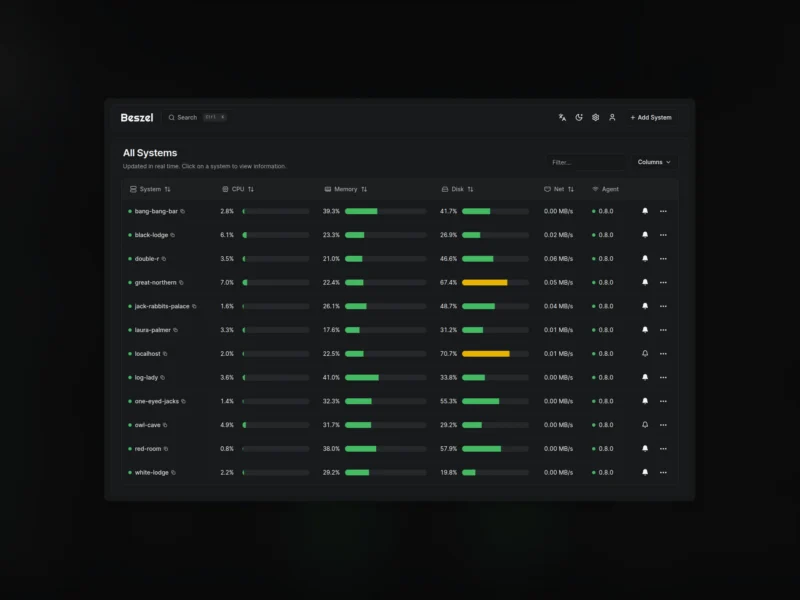
Beszel is a lightweight server monitoring hub: one small web application that collects CPU, memory, disk, network, GPU and container metrics from the machines you point it at, keeps the history, and alerts you when something crosses a threshold. It is built to be noticeably lighter than the monitoring stacks people usually reach for, and to be running in minutes rather than an afternoon.
How it works
Two pieces. The hub is a PocketBase-backed web application that holds the metrics and renders the dashboard. The agent runs on every system you want to watch and pushes its metrics to the hub over a single port (45876 by default). Adding a machine means installing the agent, pasting the hub’s public key and a token, and leaving it running — there is no exporter, scrape configuration or time-series database to assemble. The hub ships as a Docker image (henrygd/beszel) or a single binary; the agent is published as Docker images and as Linux packages for amd64, arm64, armv5/6/7, mips and mipsle.
What it tracks
- CPU, memory (including swap and ZFS ARC), disk usage and disk I/O, per host and per Docker or Podman container
- Network usage and response-time monitoring, with interruption detection run from the agent
- Load average, temperature and fan-speed sensors, battery charge, and Nvidia/AMD/Intel GPU usage and power draw
- S.M.A.R.T. disk health with failure notifications, including eMMC wear and Linux mdraid array health
- ZFS pool capacity, health, I/O throughput, scrub status and per-dataset usage
- Docker and Podman container status and resource history
Alerts and access
Alerts are configurable per metric and deliver to a long list of notification services. Multi-user support lets each user manage their own systems while admins share systems across accounts, OAuth2/OIDC login can replace passwords entirely, and automatic backups write to disk or any S3-compatible bucket. There is an API for scripting, and the whole interface is translated rather than English-only.
Who it is for
Homelabs, small fleets and self-hosters who want history and alerting without running Prometheus, Grafana and an exporter per host. If you need log aggregation or trace-level observability rather than host metrics, this is the wrong tool — it monitors systems, not applications.